On May 1983, one of the strongest El Niño events of the past century was about to finish its life-cycle in the Pacific Ocean. As usual with these strong events, it generated major changes in the weather and climate across the world.
More locally, warmer than usual sea surface temperature lead to an extremely active tropical cyclone season during the 1982-1983 warm season. According to the University of Hawaii, Dept. of Meteorology, 16 cyclonic system developed south of the Equator Line, from October 30, 1982, to May 1983. Fourteen of these cyclones reach the intensity of tropical storms.
The high level of activity, enhanced by El Niño onset, produced two tropical depressions at the East of 130ºW. The tropical depression of our interest is the one named as «2» (TD2). Usually, when these systems don’t reach surface sustained winds intensities above 62 Km/h, they do not receive names, and they are just numbered in order of appearance. However, new analysis suggest that TD2 may deserve one.
In a public email from Luis Muñoz (meteorologist from the Universidad de Valparaíso), he showed how this tropical depression may actually be a tropical storm. Under his analysis, the maximum sustained winds reached 64.8 Km/h during the morning of May 14, 1983, surpassing the threshold of 62 Km/h required by the definition of NOAA to classify a tropical cyclone as a tropical storm.
In order to follow the new insight about this potential new tropical storm, We decided to run an analysis using one of the newest and state-of-the-art reanalysis: ERA5 from ECMWF.
Winds from ERA5
Before starting, let’s introduce the types of wind data that you can find in ERA5. Winds at 10 m, estimated from ERA5, are at least 3: the classic u and v winds components (from where you can easily compute the total wind, V10), the instantaneous wind gust (i10fg), and the maximum wind gust observed in the last hour (fg10). For these two last variables, it is only possible to obtain the intensity but not the direction of the gust. Confusing? Yes, it is. However, this table may help you to deal with the types of winds:
| 1 | 2 | 3 | |
| Variable Name in NetCDF data from ERA5 | u, v (V10) | i10fg | fg10 |
| Description in the NetCDF file | 10 metre U,V wind component | Instantaneous 10 metre wind gust | 10 metre wind gust since previous post-processing |
| From the website Copernicus | It is the horizontal speed of air moving towards the east/north, at a height of ten metres above the surface of the Earth | Maximum wind at 10 m at the specific time | Maximum 3 second wind at 10 m height as define by WMO |
| My interpretation | Instantaneous wind at the exact hour (large scale wind) | Wind gust at the exact hour | Maximum WMO-defined gust, observed at any moment during the last hour |
| Used in the figure? | Yes (the quiver in the map, and the thick red line in bottom panel) | No | Yes (color in the map, and thin red line in bottom panel) |
The way to measure the wind intensity and then classify the tropical systems, is based on the definition of NOAA. They use the concept of «maximum sustained winds» (SV10), which is obtained from wind measurements and observing the most intense values that are maintained from 2 minutes or more during any period of time.
In such manner, the wind data extracted from ERA5 won’t allow us to actually classify our tropical system. The total wind (V10) is the wind at the exact hour. This leave out any possible winds observed between the current hour and the previous hour of analysis. In the case of the gusts (both i10fg ad fg10), they are simply too small in terms of time to reach the 2 minutes concept.
However, we can assume that the magnitude of the SV10 (the 2 minutes average) should be found between the magnitude of the total wind V10, and the gusts. Naturally, gusts will be stronger than a 2 minutes wind average:
V10 < ? SV10 < fg10
It is also important to mention the difference between the observations and the reanalysis. Due to the current limitations of resolution, parametrization, among others, it has been already assessed that ERA5 underestimate the real wind in the high frequency part of the spectrum, such the subdaily or hourly resolution. Under these assumptions, we should expect that ERA5 underestimate the real wind from this tropical cyclone, so the real wind should be larger than the one resolved by the reanalysis.
The unnamed tropical storm from ERA5
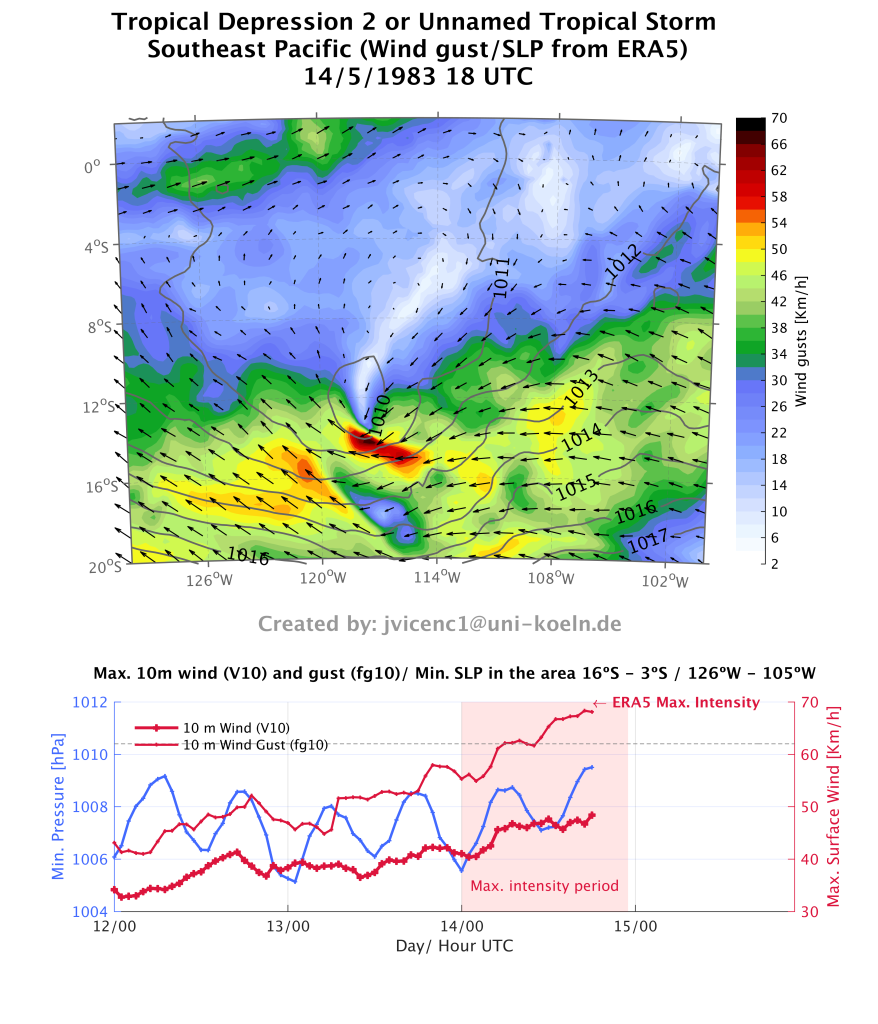
The next figure (GIF) shows, in the upper panel, the field of surface pressure (sea level pressure, SLP) in gray lines and the maximum wind-gust from the previous hour (in table, the fg10). Images are shown every 2 hours from May 12 at 00 UTC, until May 15 at 22 UTC.
It is possible to observe the formation and development of a cyclonic circulation around May 10 at 10 UTC, mostly on the wind fields. This circulation center is located at 4ºN and 112ºW.
On May 12 and May 13 (the first images in the GIF), the cyclonic circulation present in the wind field, also show a depression in the SLP, moving toward the southwest. The maximum total wind (V10), and the maximum gust (fg10), in the area around the tropical cyclone, present an increment in magnitude (see bottom panel), reaching at the end of May 13 around 40 Km/h for V10, and 57 Km/h for the gusts.
May 14, identified by the colleagues as the day of maximum intensity of the system, show a clear signal of a closed depression in the SLP field with maximum winds in the poleward region of the cyclone. In the map, we observed red colors in the 10 m Wind Gust intensity, indication of velocities above 60 Km/h.
On May 14 at 17 UTC, ERA5 identified the maximum intensity of the system in terms of winds. The total wind (V10) reached 47 Km/h (red thick line in the bottom panel), meanwhile the wind gusts (fg10, red thin line) measure 68.3 Km/h. Once again, this last type of wind is not the one we need to classify tropical cyclones. However, there is a high chance that this magnitude is closer to the 2-min average of the definition (SV10), even without considering the potential underestimation of ERA5. The next table summarized these two types of maximum winds estimated by the reanalysis and the hour of occurrence. Wind gusts (fg10) above 62 Km/h were observed between 11 and 21 UTC of the same day, the period of major intensity of the system.
| Winds at 10 m above ground | Magnitude | Description and date |
| Total wind max intensity (V10) | 47.0 Km/h | 1983 May 14, observed at 17 UTC |
| Wind gust max intensity (fg10) | 68.3 Km/h | 1983 May 14, observed between 16-17 UTC |
The minimum pressure in the area behaves strange. Look at the blue line in the bottom panel of the figure. During all the period, we observed a double cycle with two maximum and minimum values each day. An artefact of the dataset or a real wave pattern in the tropics?
Despite this, the sea level pressure reach the lowest value at 00 UTC on May 14, with 1005.6 hPa. After that, it tends to increase (including the wave pattern). The intensification of the winds seems to be more related with a stronger pressure gradient of the tropical low with the high pressure in the south, rather than an intensification of the low pressure itself. This could explain why the system develop an area of maximum winds in the poleward region, but not in the equatorward area.
If the GIF was too fast, here is the closest moment to the major intensity of the tropical cyclone, when the winds reached around 68 Km/h, the center of the system is enclosed by one isobar, and the cyclonic circulation is present in all the area. The center of the system at this moment is 12ºS and 117ºW.
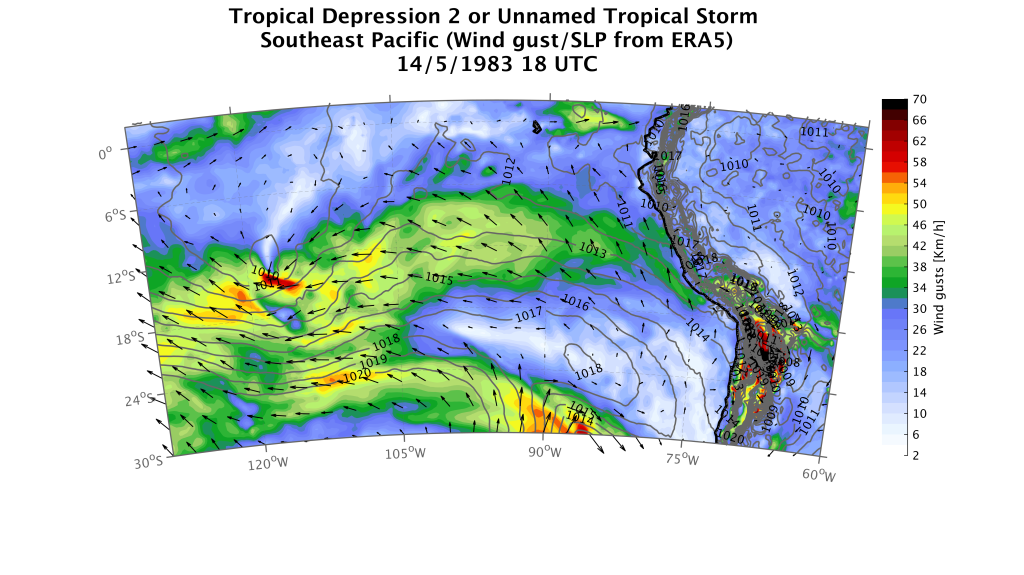
Finally, it is important to mention that this system didn’t affect any island or populated area. However, it is curious the formation of a tropical cyclone so far East as this one. On May 12, it was located at 3,415 Km from the coast of Pueblo Nuevo de Colan in Northern Peru, and at 2,299 Km from the Galápagos Islands (Ecuador). In the moment of major intensity, in which probably the system was a tropical storm and not a tropical depression, the center was located at 12ºS and 117ºW. This is, at 4,218 Km off the coast of Reserva Illescas in northern Perú, and 5,267 Km from Arica, Chile (Atacama Desert). In the next figure, you can appreciate the location of the tropical cyclone center close to the red color area in the left of the map, and the distance to South America.
TD2, or unnamed tropical storm, is the tropical cyclone formed more close to Southern Hemisphere area of South America since the satellite era began in 1979. During other El Niño years, such as 1997/98, the South Pacific basin lived even highest levels of tropical activity. However, it has not repeated the formation of a tropical system so far East as in 1983.
Source of information:
- Email from Luis Munoz, Meteorologist.
- Analysis of the El Niño 1982-83: https://ensoreview.com/enso/1982-1983-el-nino/
- University of Hawaii, Institute of Meteorology: http://www.soest.hawaii.edu/MET/Enso/peu/update.dir/Update-1stQtr98.html
- ERA5 data from Copernicus: https://cds.climate.copernicus.eu/#!/home
- Discussion about the wind in ERA5 data, in Confluence Q&A: https://confluence.ecmwf.int/pages/viewpage.action?pageId=235629737
- NOAA definitions for tropical cyclones: https://www.weather.gov/mob/tropical_definitions
